https://www.acsysteme.com/wp-content/uploads/2023/10/Salon-data-2023-conference-Stephanie-Lescarret-nutrition-animale-750x422.jpg
Salon-data-2023-conference-Stephanie-Lescarret-nutrition-animale

Conference by Stéphanie Lescarret – animal nutrition: how to show farmers how their farm is performing?

Conference by Stéphanie Lescarret
Animal nutrition: how to show farmers how their farm is performing?

During the event “Salon de la Data et de l’IA”, Stéphanie Lescarret presented a case study in the use of algorithms, data processing and visualisation, for CCPA’s livestock technicians.

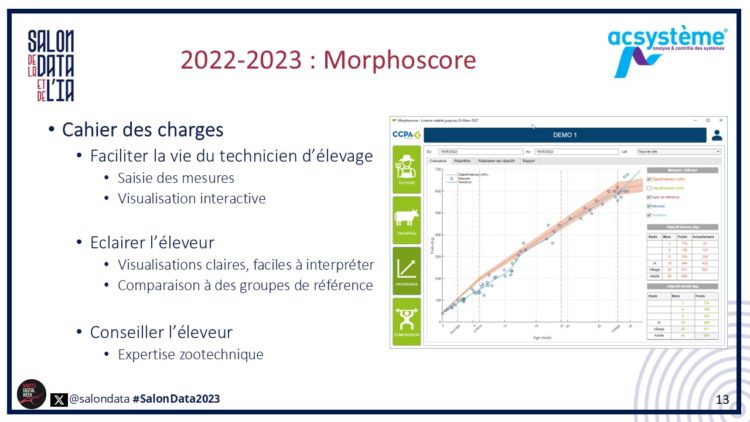
As part of its animal nutrition consultancy activities, CCPA has developed a tool for its livestock technicians to capture and analyse morphological data from ruminant herds.

The aim of this conference is to explore the following topics:

  • the difficulties of collecting measurements on the farm (at the cow’s feet!),
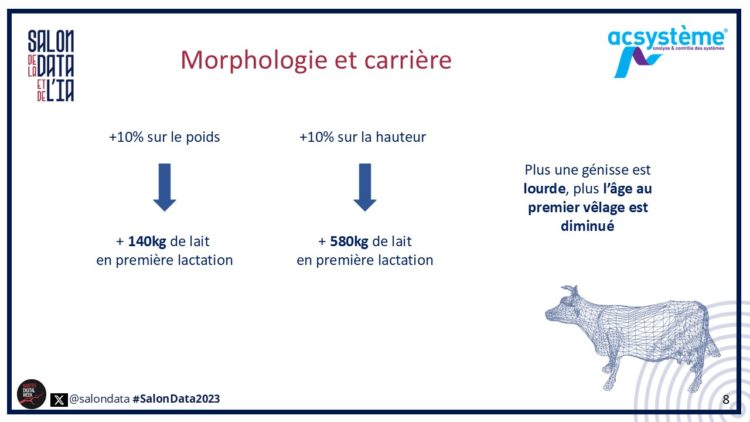
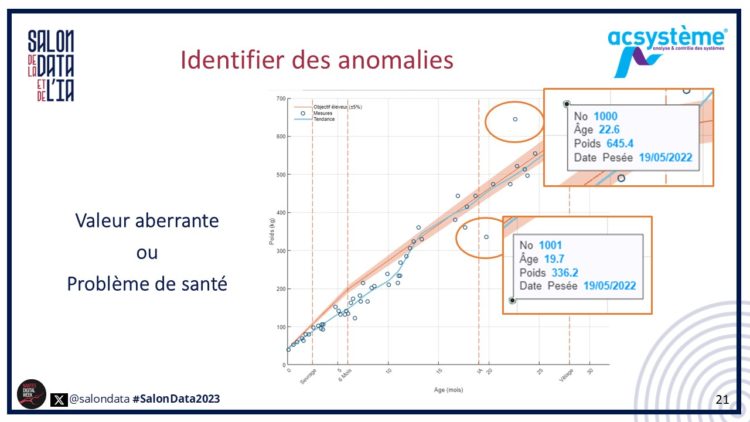
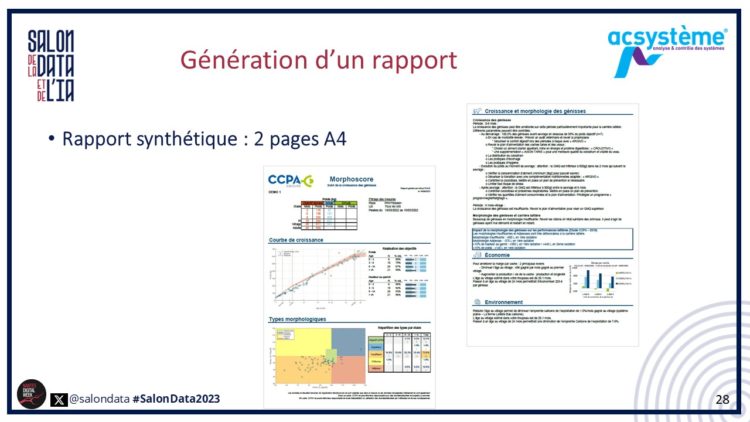
  • making most of the data through zootechnical expertise,
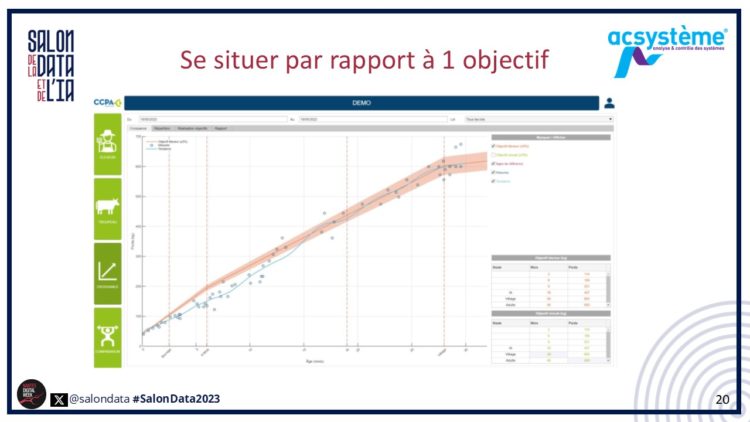
  • interactive visualisations for farmers, to help them make informed decisions.
https://www.acsysteme.com/wp-content/uploads/2023/10/Salon-data-2023-conference-Stephanie-Lescarret-nutrition-animale-900×506.jpg
Salon-data-2023-conference-Stephanie-Lescarret-nutrition-animale

Confyrence by S. Lescarret – Salon de la Data ’23

Conference transcript

Stéphanie Lescarret, Acsystème

[00:00] Hello everyone.

What I’m proposing to show you today is how we can use data in a very pragmatic, very factual way in a context where we do not usually talk about data and AI. This is the context of livestock farming and animal nutrition.The aim of this presentation is to show you how we have developed software with CCPA making it possible to show farmers how their farm is performing. So I am going to tell you a little about this project.

[00:47] The CCPA Group is an international group which is an expert in animal nutrition and health. It has almost 50 years of technical expertise and a very demanding vision of animal nutrition and health to provide a real spotlight on efficiency in livestock farming.

As a result, they have a capacity for innovation and a spirit of service that drives their desire to develop tools and solutions with their farmers in the various types of livestock farming, which they will be able to share so that they can really undertake precision farming. As a general rule, they will be able to develop tools or sell animal nutrition for poultry, pigs, ruminants and rabbits. What we are going to see today is more in the field of heifer rearing.

[01:51] With most of these companies in the group, CCPA provides support for farmers. So farmers might think they are working somewhat on their own, but in fact they will be looking after their herds. They have herds of varying sizes, which they give a very specific feed, and the entire management of their herds will have an impact on the health and production quality of their herds.

However, they are rarely on their own. This is where CCPA comes in, because they will have with them a livestock technician who knows his job well, is close to the farmer, and who will visit the farms. CCPA also offers R&D services, so they will be able to carry out animal feed formulation. It also has zootechnical experts who will be able to provide their expertise for understanding the mechanisms which can link nutrition to everything that concerns the animal, both in terms of health and production.

[03:09] What is behind all this? At CCPA there is also an IT team with the potential to develop tools to help farmers and livestock technicians. In this context, what interests us is to see how the livestock technician, using a tool, with the farmer, can measure the performance of the herd, above all in the hope of improving production. It is really just like any other project where we are handling data. The aim is a return on investment.

[03:52] What we will try to look at is taking advantage of studies which have been carried out at CCPA and which link the morphology of heifers and the way they have been reared, their growth up to first calving (the first time they have a calf) and the milk career they may then have.

[04:23] CCPA takes advantage of its zootechnical expertise, as well as experimental farms, and all the knowledge they have with the farmers to whom they are affiliated. They were able to carry out a study on 27 farms, with an average of thirty heifers per breed. This study was actually on a breed of cow where the average age at calving was 26 months. And the adult live weight is the weight the heifer is supposed to have when fully grown.

This study has taken some time because it started in 2015 by measuring the height at the withers and the weight of the heifers. And in 2019, once these heifers had really finished growing, we were able to cross-reference production and reproduction data, and also see what the date of the first calving really was and whether it went well. Also information on culling and health to see if, in the end, the cow was in good health, and then potentially surveys to give a little more information on all this.

[05:41] The conclusions of this study show that if weight is increased by 10% there are 140 kilos more milk in the first lactation. So that’s a plus. A slightly larger cow produces more, and the same thing happens with height. As it happens, a larger cow will produce much more. And the heavier the heifer, the lower the age at first calving, so unfortunately it is hard to put it like this but the more profitable it is.

So CCPA’s idea is to say that if we can define a weight and height objective, which can be represented here on a curve as a function of age, indicating weaning and the important dates for the farmer (insemination and calving) quite well, we can define this curve. Then we will be able to classify the cows into 5 morphological classes.

https://www.acsysteme.com/wp-content/uploads/2024/08/Conf_SLt_slide_1-750×422.jpg
Conf. Lescarret - morphologie et carrière.

Slide “Morphology and career”

So already it is really the work of CCPA’s zootechnicians to develop this representation, which is quite easy to access. That is where it’s interesting because we will see that for the farmer he immediately has a clear view of things. So, in fact, we see that, in relation to the weight objective we have set, which is an average target, we will have cows classified with clear names: skinny, underweight, fat, above target. The ideal is naturally to go to the very top. However, the advantage is that we are able to characterise the herd with something fairly basic, and it is from there that we can start to talk about herd performance and imagine what the expected production of this herd is.

[07:50] On the basis of these observations, CCPA wanted to develop an IT tool, because it has to be possible to visualise this. A tool that stores measured data, processes it statistically and visualises it, so that this data view enables the farmer to change or adapt his management to do things better.

Although, as usual, this kind of thing starts with an Excel product that doesn’t necessarily work very well, is not very robust, in which data entry isn’t always simple, and which is a little lacking in ergonomics and interactivity in the visualisations.

And that’s where Acsystème comes in.

[08:40] Our job is to analyse and control systems. We are engineers whose role is to boost performance. So far so good, because boosting performance is what you want in a herd. But we weren’t really used to a herd. We work more in the automotive and industrial sectors, which are also very concrete, but we wanted to move into the agri-food and farming sectors, where actually these issues of data science, data visualisation and algorithms are new. However, there is real potential to help people understand the value of data and how they can use it to manage their farm.

And so, as we also develop decision support tools for other major groups, we were taken on by CCPA to develop a new version of the software. We said “it’s a deal, it seems a good idea”.

[09:45] For the year 2022 to 2023, we developed the Morphoscore software where the idea was actually to score the heifer’s morphology and the specifications. It was really to make life easier for the livestock technician in entering the measurements. To have interactive visualisations, because in Excel it is rather immobile. Enlightening the farmer really means creating visualisations which will give him references, objective information that will make it possible to take decisions and then also to advise the farmer with zootechnical expertise. In other words, to put CCPA’s technical expertise into this tool.

https://www.acsysteme.com/wp-content/uploads/2024/08/Conf_SLt_slide_2-750×422.jpg
Conférence S. Lescarret - Morphoscore CDC (slide)

Slive “Morphoscore’s specification”

We tried to develop something that was rather nice, colourful, with large themes like the farmer, his herd, analysing its growth and making comparisons.

So I will go into a little more detail about some of the principles of this development.

[11:01] The first is the collection of operational data, because that’s not really very easy. It is true that we’ve seen quite a few examples today of things which will be put into Data Lakes, things like that. But in fact, when you’re on a farm, it is quite complicated. You’re standing right under the cow to take measurements, so measuring height at the withers is done with a measuring rod. As you can imagine, when you’re standing next to a cow with a measuring rod, it is hard to enter the details on the computer, so it often takes 2 people.

We said that the study required weights. For these weights, we don’t always have scales. This equipment is very expensive for farms so we won’t be able to do that. Once again, using zootechnics to help farmers, CCPA has developed curves which make it possible to link weight to chest circumference, and using these formulas, we can make the calculation. Now we have another tool, this tape measure for measuring cows.

[12:13] Measurement means measurement campaigns. As you can see on this illustration, in fact we will only measure one each day. The day we decide to measure, if possible there will be 2 people, because effectively there is one person measuring and one taking notes, and it has to be a chain. So the aim was to develop something that would make all this easier and even make it easy enough to do it every 6 months and have real feedback that would allow management to be changed.

[12:46] So we have developed an appropriate input interface. You can enter the heifer’s number, date of birth and weighing date. We are going to write down the chest circumference and the height at the withers.

And at a pinch this is all the information required. For the rest, most things will be calculated automatically, which will also allow verification. What very often happened was that it was written on a piece of paper, an Excel sheet or something. Then, in the end, it wasn’t that at all. Whereas here we can see straight away where we are in terms of objectives, so straightaway if we’re at 60% we know there’s a problem. The tool calculates the age for us, you can see straight away. The farmer and the technician know the herd well, so they can check this data immediately. And then the information that isn’t useful, it is at the bottom. We have tried to produce something that’s really ergonomic so that in the end you press tabulation 3 times, but only the right information and the entry is performed and follows on with basic buttons. So the idea was really to provide ergonomics via a tool that would make data collection more reliable.

[14:08] Then, as always, we collect data here and there. This is always the case with data science tools, so import tools were also needed. In the end, we managed to create a database that’s fairly easy to see, with information which is starting to classify morphologies.

[14:30] Once this was done, the important thing is to visualise to make a decision. That’s really the objective, and so the advantage of the tool is to be situated in relation to an objective. Typically speaking, the objective is also set by the management rules of the art. However afterwards the farmer can also set slightly more ambitious objectives, or just feel that anyway it was much too ambitious, so it’s better to settle for something a little lower. It’s therefore the farmer who has set his objectives with the help of the livestock technician and, in fact, with very basic visualisation we will show him the state of his herd in relation to this objective.

We have not invented anything, there’s nothing exceptional about this presentation, but it immediately identifies how things are.

https://www.acsysteme.com/wp-content/uploads/2024/08/Conf_SLt_slide_3-750×422.jpg
Conference S. Lescarret - objectif (slide)

Slide “Objective”

It can clearly be seen that at the start of growth, we were not yet there, and the farmer must surely have realised that something was going on. And then he had to change his feed, or feed better for the older cows, and that’s how he achieved his objectives.

[15:38] An interface like this can also be used to detect anomalies, i.e. anomalies such as an outlier. So here the one at the top is really an outlier. The bottom one could be the sign of a health problem, so something which is really different. What we’ve added, which could be – but these are really silly things that didn’t work in Excel – is being able to see which heifer is presenting these difficulties and review the important values.

https://www.acsysteme.com/wp-content/uploads/2024/08/Conf_SLt_slide_4-750×422.jpg
Conference S. Lescarret - identification des anomalies (slide)

Slide “Identification of anomalies”

[16:09] And finally, the famous 5-category breakdown, which makes it possible to take into account quite quickly, visually and without numbers, where you stand in relation to the objective. In this instance, with this example, it can be seen that globally we are down and therefore the heifers’ morphology is underweight.

[16:40] The idea is also to be able to quantify and explain explicitly, so there is no contradiction. It is in the software, it will be things that are going to be looked at more and more. And in detail, we will look at it and will really indicate the number of cows in each category. We’re also going to divide them into 4 age groups: between 0 and 3 months, 3 and 6 months, 6 months to insemination and then after insemination. These are things that will make it possible to report more factually. Finally, on the weight of the heifers, things that also show where we are in relation to the objective. The same applies to weight and height.

The idea for a farmer is that, in fact, this is found from the start. He sees the first visualisation and knows what he has to do. After that, it may be more advantageous when he wants to compare before and after, and then it will be interesting to have the figures.

[17:39] And finally, one of the last interesting options for him is to compare. The tool will therefore also make it possible to define groups. A tool for the livestock technician who will look after several farms, and the advantage of this is that the livestock technician can say to himself: “I have 3 or 4 farms that have this type of management, this type of feed” and he will put them in a single group. He will be able to put all this data together, produce statistics, and it will be possible to compare these statistics. The farmer will therefore be able to compare himself with a reference group which the livestock technician will be able to explain to him.

We’ve also done things to make it anonymous, so if he makes the comparison, he doesn’t know exactly which farm he is comparing his own with.

[18:42] The final objective for CCPA, and for the livestock technician, is really to advise on herd management. So the formatted data are already first piece of advice, At first we thought that more was needed, but finally it was enough to show them where they stood, using the formatted data presented in a simple, fun and educational way. Or even carry out close monitoring to identify good practices, because I’ve shown an example where this was not going well and where we were rather at the lower end of the morphologies. However, you can also be in the opposite situation, in the upper quadrant, and say to yourself that this is good practice.

And comparing that to something just as interesting, that it makes it possible to envisage achievable performances. If we don’t know that a farmer, or a group of farmers, has succeeded in reaching an objective as a result of these practices, then one can say that there’s no point in raising the objective. As a result this enables them to realise what they could really envisage in terms of performance.

[20:18] Finally, using this visualised data, we have nevertheless made several statistical calculations that also make it possible to calculate the ADG (Average Daily Gain), i.e. the way in which the animal grows each day, which is the most important growth indicator. We also define the expected age at live weight, things like that, and in fact CCPA, using its zootechnical knowledge, has created an analysis tree. Depending on the conditions, and on what has been calculated objectively for the farm, CCPA will propose a series of recommendations. So, of course, nutritional recommendations on products that the livestock technician sells can be configured, and then it can also be customised depending on the technician.

He may know that a farmer is already doing something, and that there’s no point in telling him. So maybe he’ll write something different. In any case, he has a guide to everything he needs to think about when advising his farmer.

[21:40] And then like the farmer, he has more than this to do. What is necessary is that at the end he has very summarised report, 2 pages like this with the visualisations that have been seen, and the advice.

https://www.acsysteme.com/wp-content/uploads/2024/08/Conf_SLt_slide_5-750×422.jpg
Conference S. Lescarret - génération de rapport (slide)

Slide “generating a report”

And there are other pages for the entire database. In any case, we decided that it absolutely had to fit on 2 pages, one A4 recto verso, that the livestock technician could give to the farmer.

[22:13] In conclusion, this software gives easier conditions for taking measurements. This was essential to make measuring easier in order to have reliable measurements in a context that is really not very easy. We have a simple, educational audit tool. This really makes it possible to improve the technical and economic performance of the farm by balancing feed rations if necessary.

[22:58] Question: I have a question, you use morphology to establish the nutritional quality provided to the heifer. There is a whole host of parameters concerning heifers and dairy cows, such as genetics, which play a major role, particularly in growth. Are you going to analyse using other analysis aspects concerning heifers?

The target is set according to the breed. So the study was carried out on Prim’Holsteins. In the software there is a whole series of breeds for which default values are proposed for the objective curve. In fact, for the moment we are stopping there. There are no other avenues because what we also need to consider is that what we want is something very simple for the farmer.

So if he starts to have too many parameters to fill in himself, or if the livestock technician has difficulty filling in these parameters, it will be difficult.

Share this post: