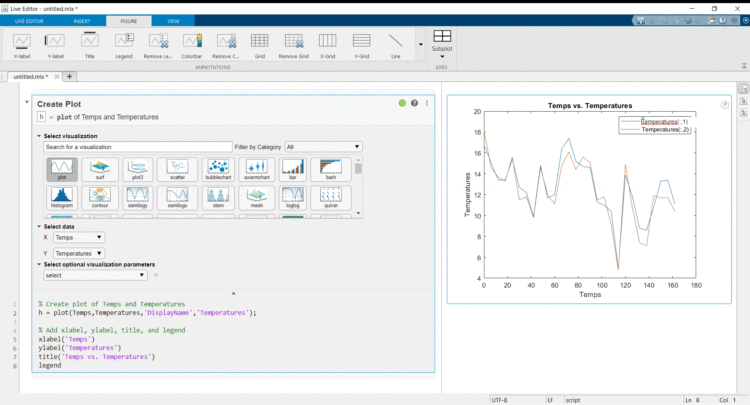
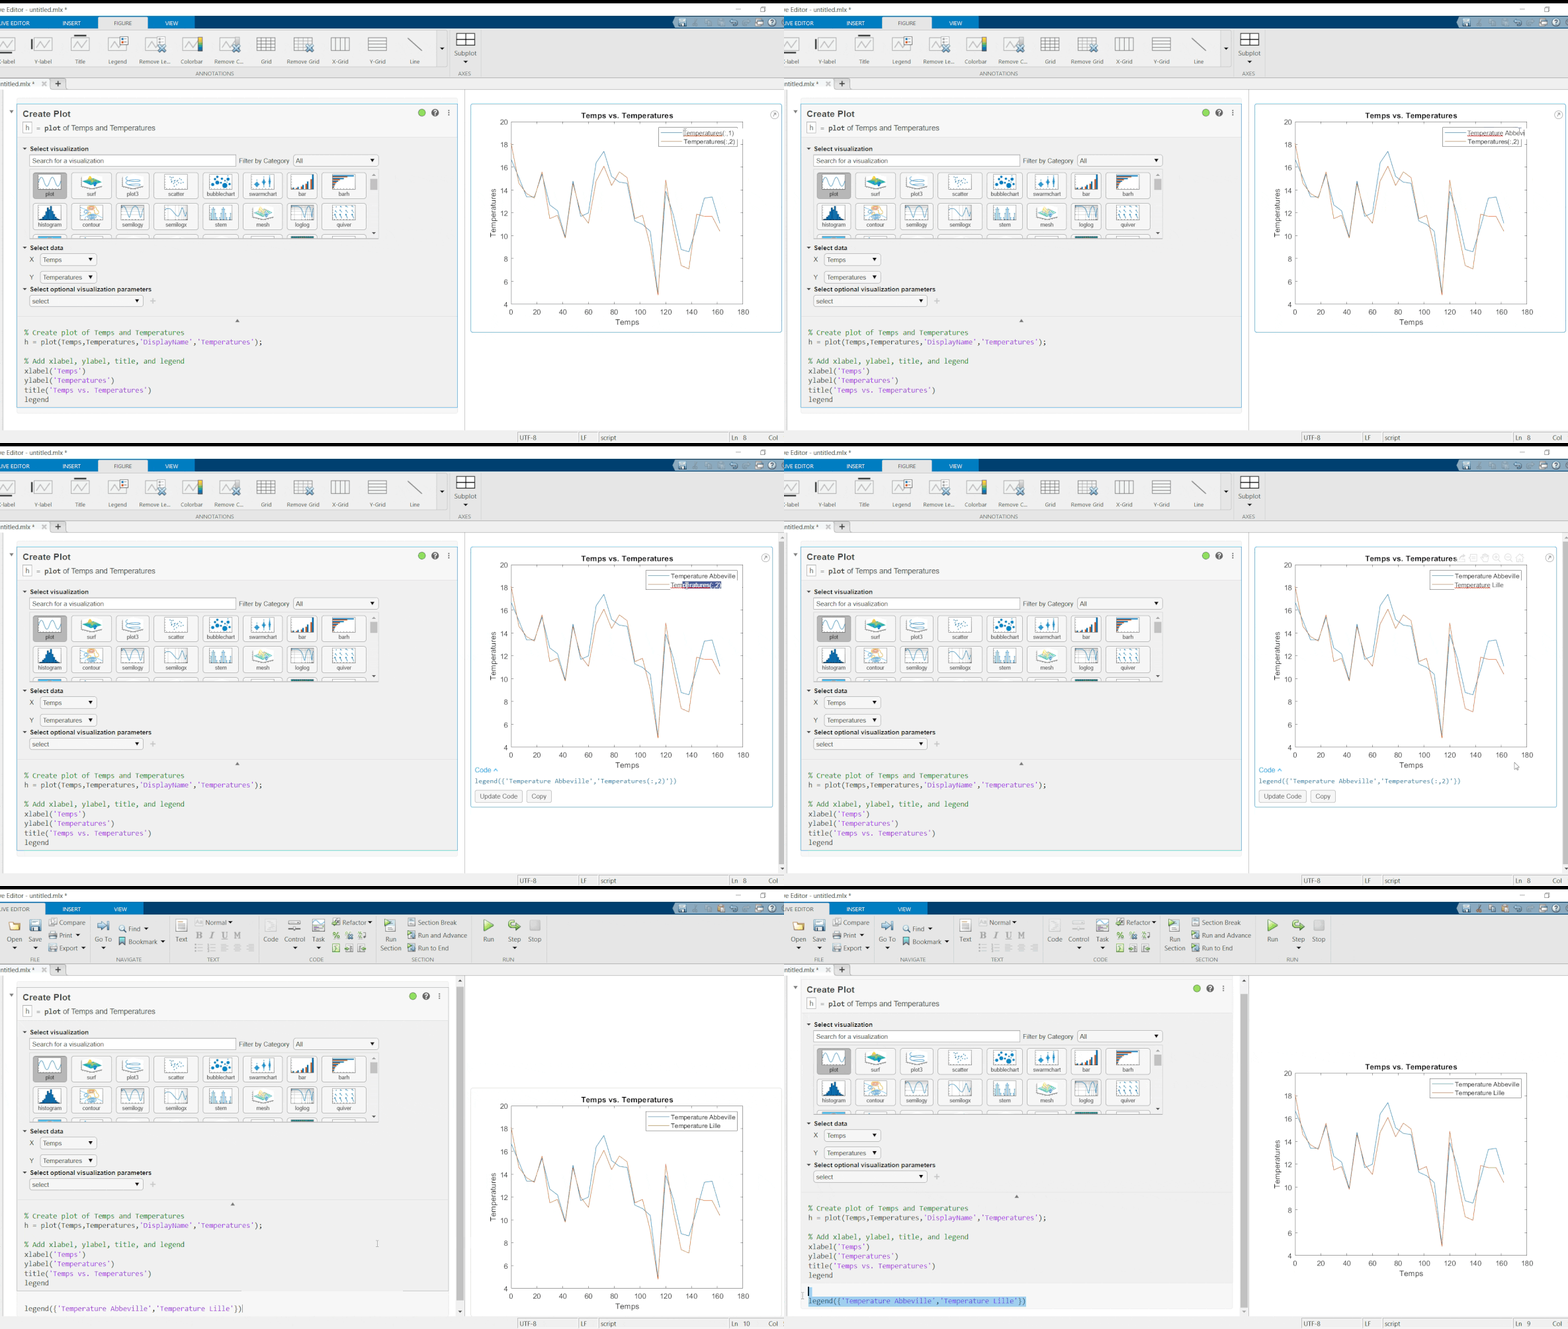
From the R2021a version onwards, the Create Plot interface is available from the Live Editor. This interface makes it possible to create clean plots quickly (with titles, keys, etc.) from data loaded into the Matlab workspace. This tool also offers the possibility of retrieving corresponding lines of code.

S01E01: Create Plot in Live Editor, by Maxime BONNET
Multiple methods are available to open the interface:
- open a new Live Script, then select the Insert menu, and in the Code section, select Task>Create Plot,
- in the Live Script code editor, type a keyword such as create, vis or visualise: the Create Plot command will be suggested,
- in the Live Script code editor, type any plot creation name (plot, bar, contour, etc.): the Create Plot command will be suggested, if the corresponding graphic type has been pre-defined.

To use this interface, data should be loaded into the Matlab workspace. It then allows the selection of data to be put in the abscissa and ordinate axes and the testing of many graph types and visualisation options. The result is shown instantly, without having to write a single line of code. Titles, labels, and keys are automatically displayed with the name of the variable from the workspace.
This tool enables them to be personalised interactively on the previsualisation figure, and the Matlab code for creating this figure to be updated automatically. The lines of code generated are available, allowing you to recreate this figure later.
On a day-to-day basis, this interface is particularly suitable for creating a quick graph, which does not require advanced functionalities (the interface does not make it possible to do everything that is available with the command lines). Graphic design becomes intuitive, without posing the question of which lines of code to write. Finally, time is saved in creating a graph, without the loss of quality
