https://www.acsysteme.com/wp-content/uploads/2021/08/saga2021-GLe-2-soustitres-1-1-750x420.jpg

S01E05: Graphs, graphs but always beautiful graphs! by GIREG LANOË

Plotting graphs? One of the pillars of Matlab!

I can still hear my uncle, a little annoyed with me last year: “You weren’t born when I was already drawing graphs in Matlab!”. You’re not wrong, uncle, but what you didn’t know is that the functions for tracing and formatting curves, with their air of senile functions, still have many surprises in store for us… And yes, Matlab in its latest versions (R2020b and R2021a) hasn’t forgotten to equip its ancestors, to transform your curves into masterpieces!
Matlab R2020b

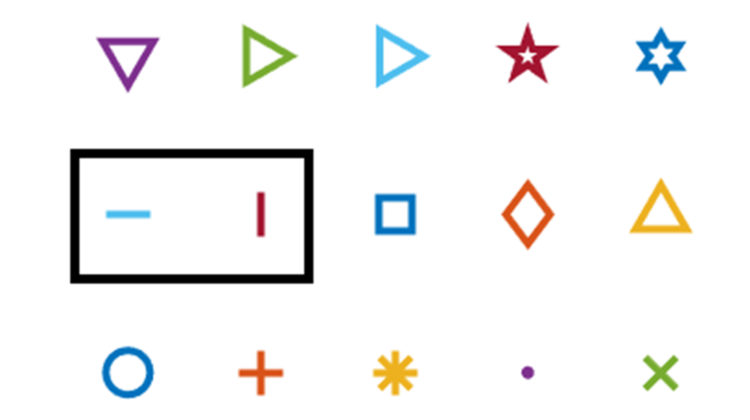
First small revolution in Matlab’s Landerneau, the arrival of 2 newborns in the marker family.

The horizontal line “_” and the vertical line “| are centred around the coordinate they represent (like the “+” marker). They are used in the same way as all the other markers.

https://www.acsysteme.com/wp-content/uploads/2021/08/saga2021-GLe-1-marqueurs-750×420.jpg
https://www.acsysteme.com/wp-content/uploads/2021/08/saga2021-GLe-2-soustitres-1-1-750×420.jpg

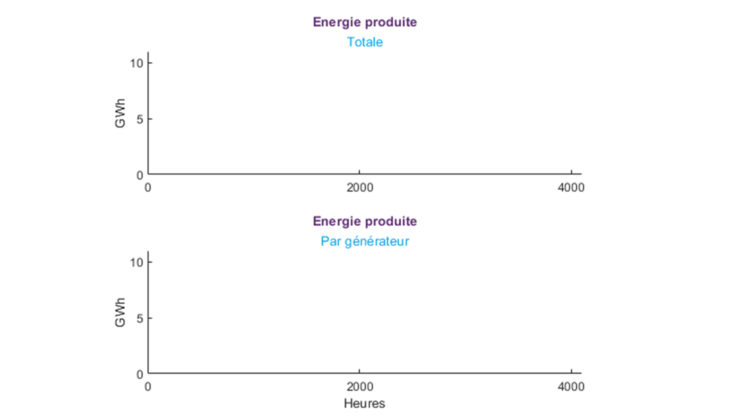
And that’s not all! Now, we can also choose the alignment of the title/subtitle and the labels for the axes (relative to the graph to which they belong) with two new properties:

  • the TitleHorizontalAlignment property of the “Axes” which allows you to define the alignment of the title/subtitle: TitleHorizontalAlignment = ‘center’
  • the LabelHorizontalAlignment property of the “Ruler” objects that define the x, y, and z axes: hAxis.XAxis.LabelHorizontalAlignment = ‘right’;

These 2 properties can take the values, ‘left’ | ‘centre’ | right.

https://www.acsysteme.com/wp-content/uploads/2021/08/saga2021-GLe-4-label-tasse-750×420.jpg

Matlab R2021b

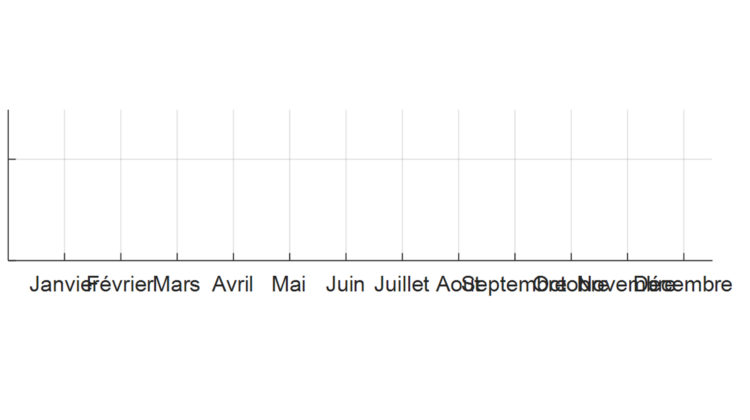
Saving the best for last! Have you ever encountered this “thing”?

TickLabels so long that, by default, they overlap each other… Until now, you had the possibility of indicating their orientation via the XTickLabelRotation, YTickLabelRotation and ZTickLabelRotation properties of the axes.

Now, by default, the most suitable rotation angle is automatically applied so that the TickLabels do not overlap:

This new feature brings real comfort, especially when observing 3D data. (See below)

It is always possible to return to the standard operating mode by moving the XTickLabelRotationMode, YTickLabelRotationMode and/or ZTickLabelRotationMode properties of the axes to the ‘manual’ value: hAxis.XTickLabelRotationMode = ‘manual’;

To avoid having to make this modification for each axis, it is also possible to modify the operation of Matlab by default via these lines of code:

https://www.acsysteme.com/wp-content/uploads/2021/08/saga2021-GLe-7-code-label-manual-750×67.png

To reset these parameters to “factory” values (automatic management of TickLabel angles):

https://www.acsysteme.com/wp-content/uploads/2021/08/saga2021-GLe-8-code-label-remove-750×67.png

On your data! Ready? Draw!

Gireg LANOË

Consult the full saga

Share this post: