With the release R2012b of Matlab also came a brand new version of the Simulink/Stateflow environment. As far as Simulink 8 is concerned, this new version is the biggest one since R2007b (Simulink 7). Acsystème’s engineers have been using it for a couple of months and are now ready to indroduce you to the new features available in this version. We also take the opportunity to mention some of the functionalities that came out between 2007 and 2012.
https://www.acsysteme.com/wp-content/uploads/2021/07/ressource-evol-Simulink-editeur-Stateflow-R2012b.png
What’s new in Simulink R2012b?
1. A new editor
Using Simulink version 8, you have probably noticed substantial modifications with the graphical interface. Menus were completely reorganised to stick to a regular use of Simulink: “Diagram >> Simulation >> Analysis >> Code”. Zoom and ‘moving with the mouse’ features were implemented.
Tab creation in the upper part of Simulink edition window help to navigate in the environment even quicker.
Browsing in hidden subsystems is facilitated thanks to an icon button in the lower left corner of this kind of block instead of right click and ‘look under mask’. Subsystems belonging to a library are also labeled with a similar icon. This icon gives direct access to conventional options linked to a library, such as “Go to library link” and “Disable link”.
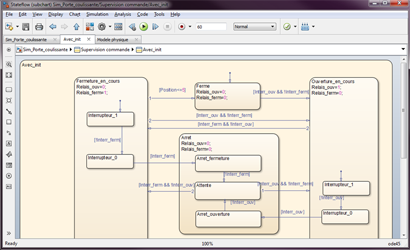
Regarding Stateflow, the editor was entirely revamped. It is now fully integrated into Simulink, as you can see in the picture below. In previous releases, Stateflow diagrams were opened in a different window and the interface suffered from a lack of homogeneity with Simulink environment.
https://www.acsysteme.com/wp-content/uploads/2021/07/ressource-evol-Simulink-editeur-Stateflow-R2012b.png
Stateflow editor R2012b
https://www.acsysteme.com/wp-content/uploads/2021/07/ressource-evol-Simulink-editeur-Simulink-R2012b.png

Simulink R2012b
2. New methods for designing models
The intelligent routing algorithm was greatly improved. As far as model designing is concerned, since the R2009b version, Simulink has got alignment and resizing tools for blocks that significantly facilitate rearrangement, as you can see in the following picture.
https://www.acsysteme.com/wp-content/uploads/2021/07/ressource-evol-Simulink-Construction-modeles-Simulink-R2012b.png

3. Evolutions of block library
Previous points proved the efforts made to enhance the graphical user interface. But what is new with basic block library? No major advances with R2012b, however two features appeared recently that deserve to be mentioned.
R2009b has had a new block created: “PID Controller”. This block has several options for simulation: PID, PI, PD, P or I controller, discrete or continuous, management of saturation and initialization… Another tool helping to automatically adjust the controller is also available (requires “Simulink Control Design” license).
Since R2011a, blocks operating with Lookup tables (interpolation) were redesigned; 1D and 2D tables merge into one block that deals with n-D interpolation tables (with n from 1 to 30). This new block has interesting features: interpolation and extrapolation methods (linear, spline, cubic or nearest neighbor interpolation) and can also diagnose in case of inputs that are out of boundaries.
https://www.acsysteme.com/wp-content/uploads/2021/07/ressource-evol-Simulink-Blocs-librairies-Simulink-R2012b.png

Interpolation using Simulink R2012b
https://www.acsysteme.com/wp-content/uploads/2021/07/ressource-evol-Simulink-Interpolation-extrapolation-Simulink-R2012b.png

Extrapolation using Simulink R2012b
4. New features for simulating models, and visualizing results.
In terms of simulation, blocks can be set as a comment. To save a block state with this new functionality, simply copy it before modifying it, and then comment one of the versions. It also speeds up the simulation by removing useless blocks.
Fast forward and backward functions are now available: from “Simulation >> Stepping Options” menu you can set and use them by pushing the buttons next to the “Start simulation” button.
To see a signal value while simulating, you can now right click on the chosen wire and choose “Show Value Label of Selected Port”.
Since R2011, a “Graphics” tab has appeared in the scope block parameters that enabled color switching for figures, axis and curves. We can (finally!) remove the black background from figures generated with scopes.
Also recall the creation of the “Signal Data Inspector” tool in R2010b. Now with R2012b, you can run it clicking on the “Record” button. This tool displays and quickly compares results coming from several simulations (it calls “Signal Logging” functions).
https://www.acsysteme.com/wp-content/uploads/2021/07/ressource-evol-Simulink-Visualiser-resultats-Simulink-R2012b.png
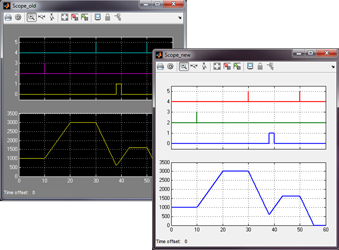
Simulating models using Simulink R2012b
5. Miscellaneous
Ther file format related to the Simulink model has changed since R2012b. The *.mdl extension was replaced with *.slx. Naturally, it is possible to save a model developed under the R2012b version as a readable file for former versions of Simulink.
Conclusion
There is no novelty with the block library in Simulink 8 whereas the graphic user interface went through a deep modification. Users of Simulink 7, after an adjustment period that can be tricky, will surely note the Simulink 8 efficiency and its user-friendly interface. New features like zoom with mouse, browsing means, comment blocks or fast forward and backward will help you to be more efficient.